LOD Cloud Quality Assessment
Results and Scripts for the Quality Assessment of the LOD Cloud
== Shortcuts ==
> Home
> Current Ranking
> Visualisation of Accessible Datasets
> Visualisation of Overall Data Quality
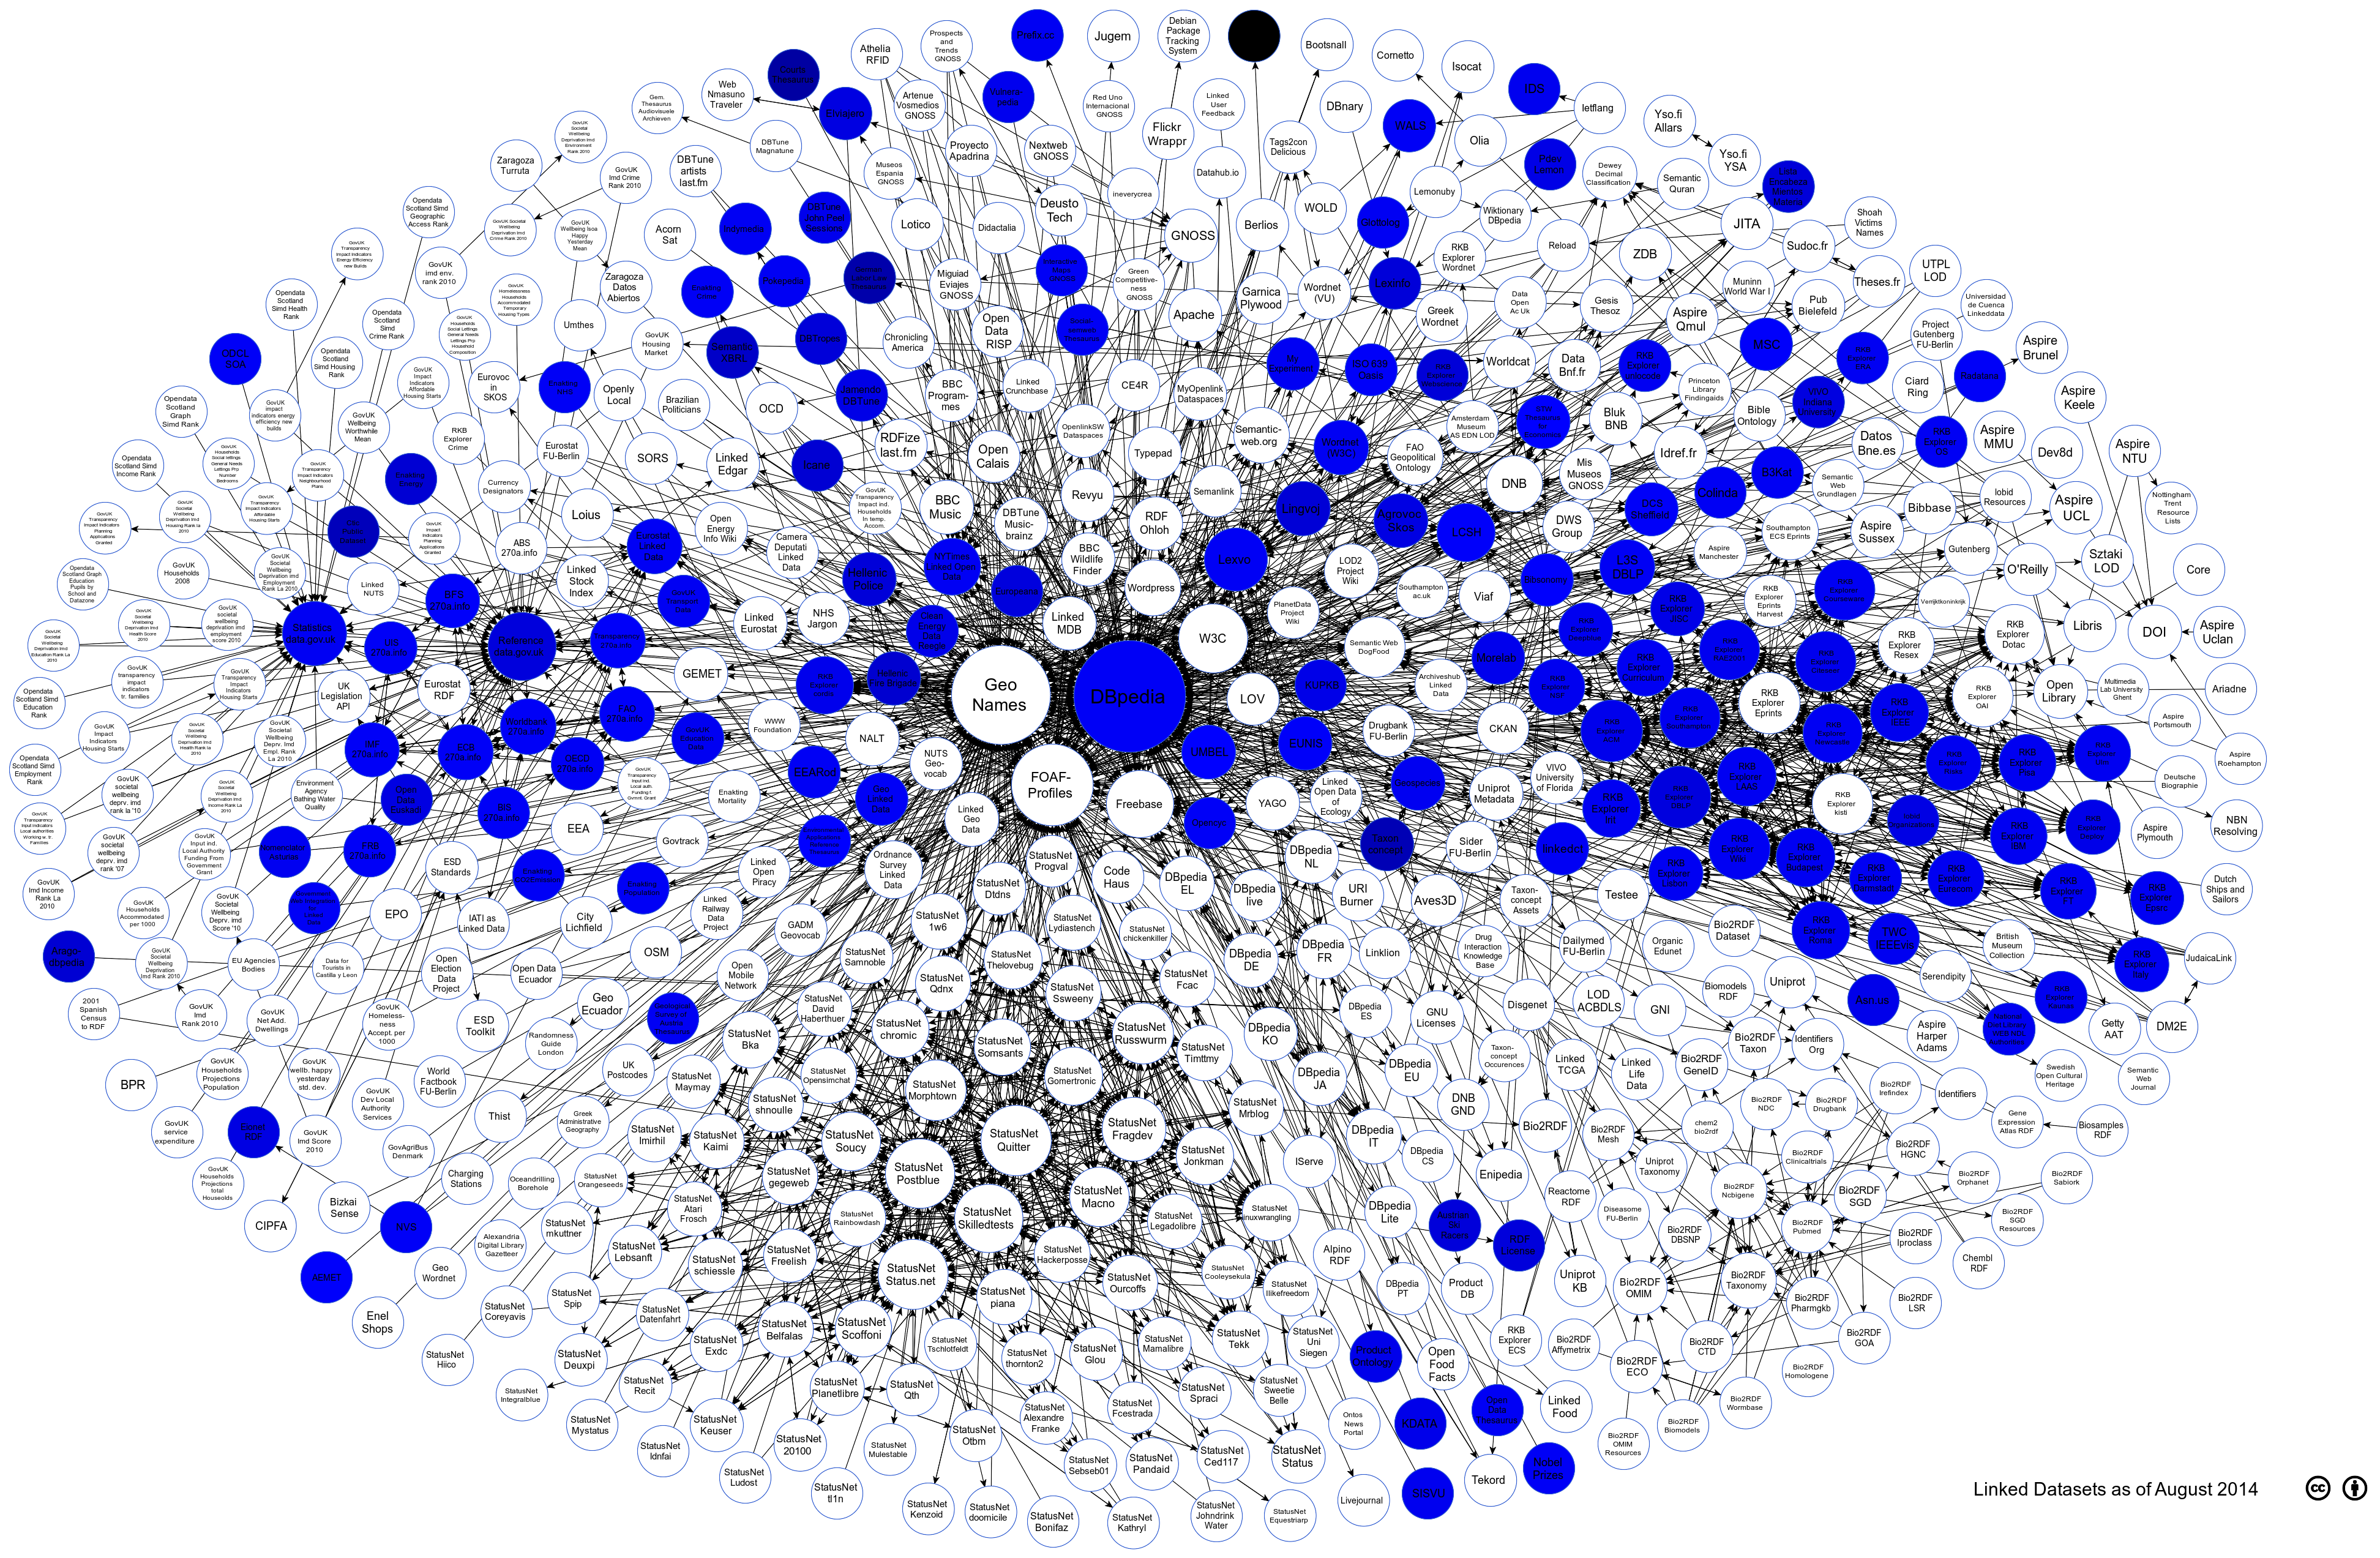
Visualising the Assessed LOD Cloud Datasets against the Intrinsic Category
The visualisation below shows how different datasets fare against each other against the Intrinsic Category metrics. The darker the color of the circle means that it has lower conformance score. Publishers tend to conform to quality issues related to the intrinsic category and this is shown with the high quality value and its moderate distribution. However, data publishers should be more careful with using the right datatyped resources in the domain and range of a property.
Summary Statistics
- Average Conformance: 73%
- Standard Deviation: 13%
- Conformance towards the usage of correct domain or range datatypes should be improved (average conformance ≈ 60%)
Attribution
Linking Open Data cloud diagram 2014, by Max Schmachtenberg, Christian Bizer, Anja Jentzsch and Richard Cyganiak. http://lod-cloud.net/"
