LOD Cloud Quality Assessment
Results and Scripts for the Quality Assessment of the LOD Cloud
== Shortcuts ==
> Home
> Current Ranking
> Visualisation of Accessible Datasets
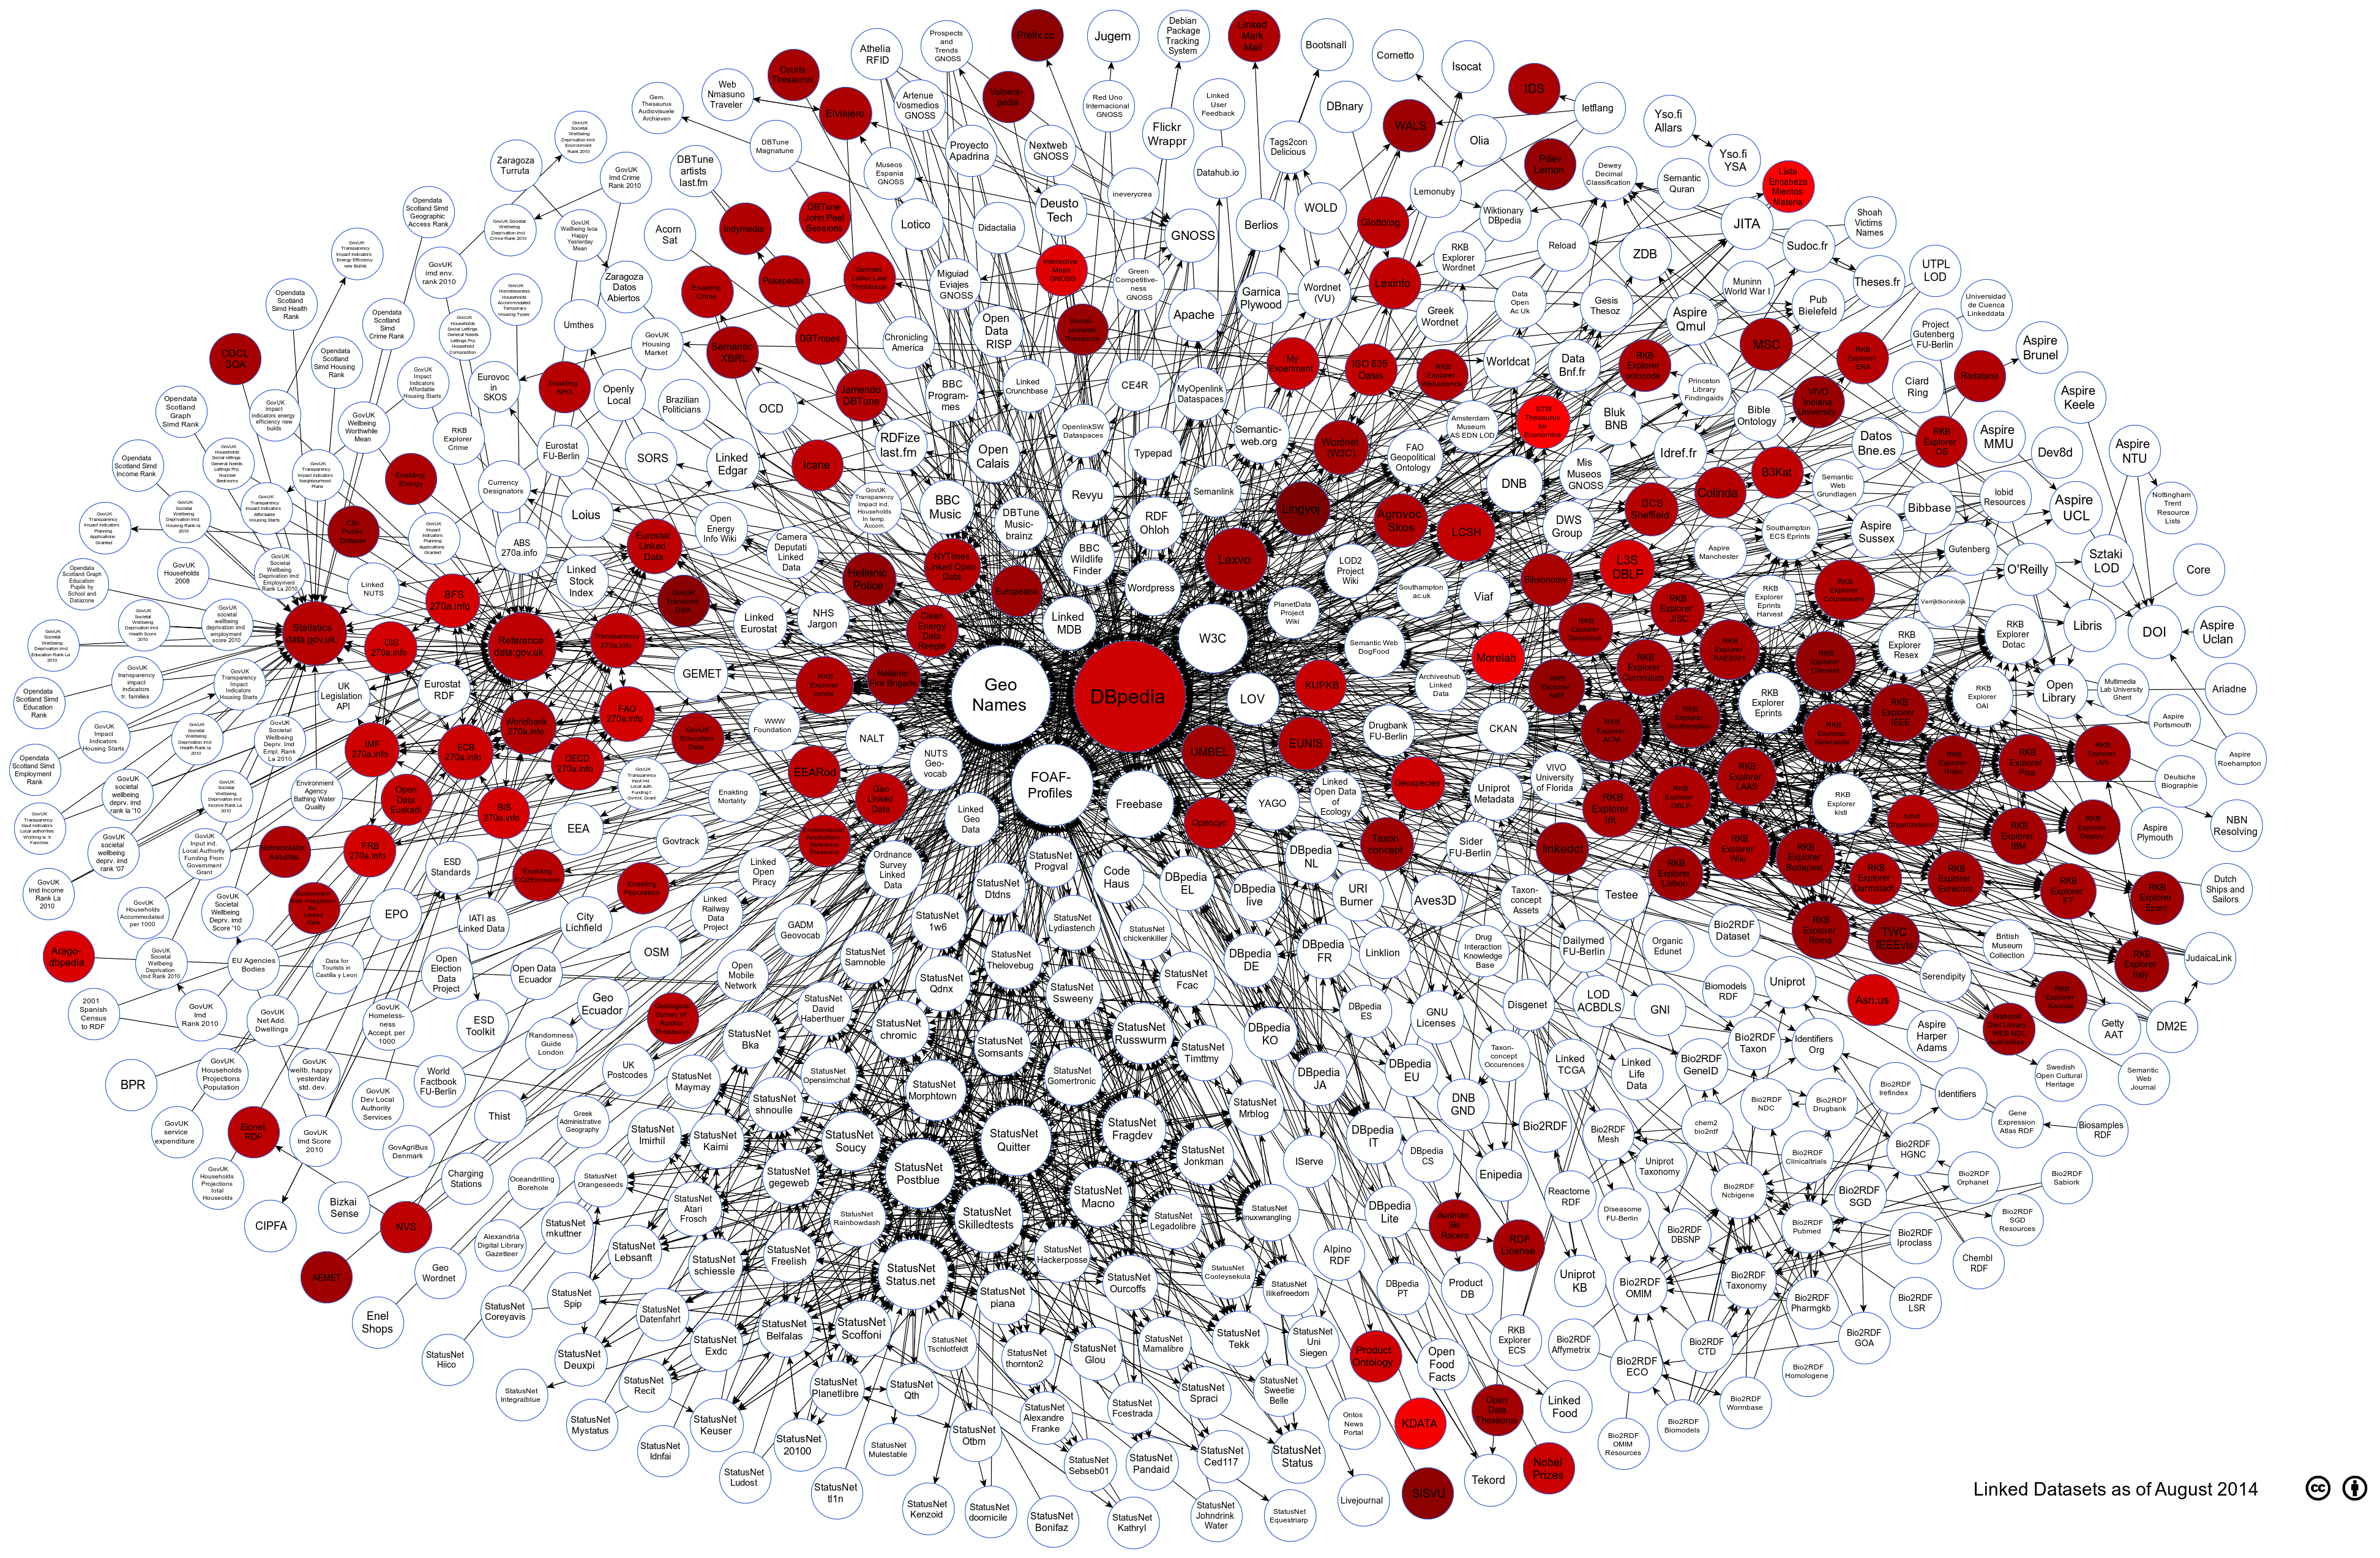
> Visualisation of Overall Data Quality
Overall Data Quality of Assessed LOD Cloud Datasets
The visualisation below shows how different datasets fare against each other when all quality metrics assessed are aggregated. The darker the color of the circle means that it has lower conformance score. On the whole, average conformance score stood around 60% with a slight deviation of 7%. This suggest that overall publishers seem to have more-or-less similar understanding of different quality issues. Click on the image to enlarge.
Attribution
Linking Open Data cloud diagram 2014, by Max Schmachtenberg, Christian Bizer, Anja Jentzsch and Richard Cyganiak. http://lod-cloud.net/"
