LOD Cloud Quality Assessment
Results and Scripts for the Quality Assessment of the LOD Cloud
== Shortcuts ==
> Home
> Current Ranking
> Visualisation of Accessible Datasets
> Visualisation of Overall Data Quality
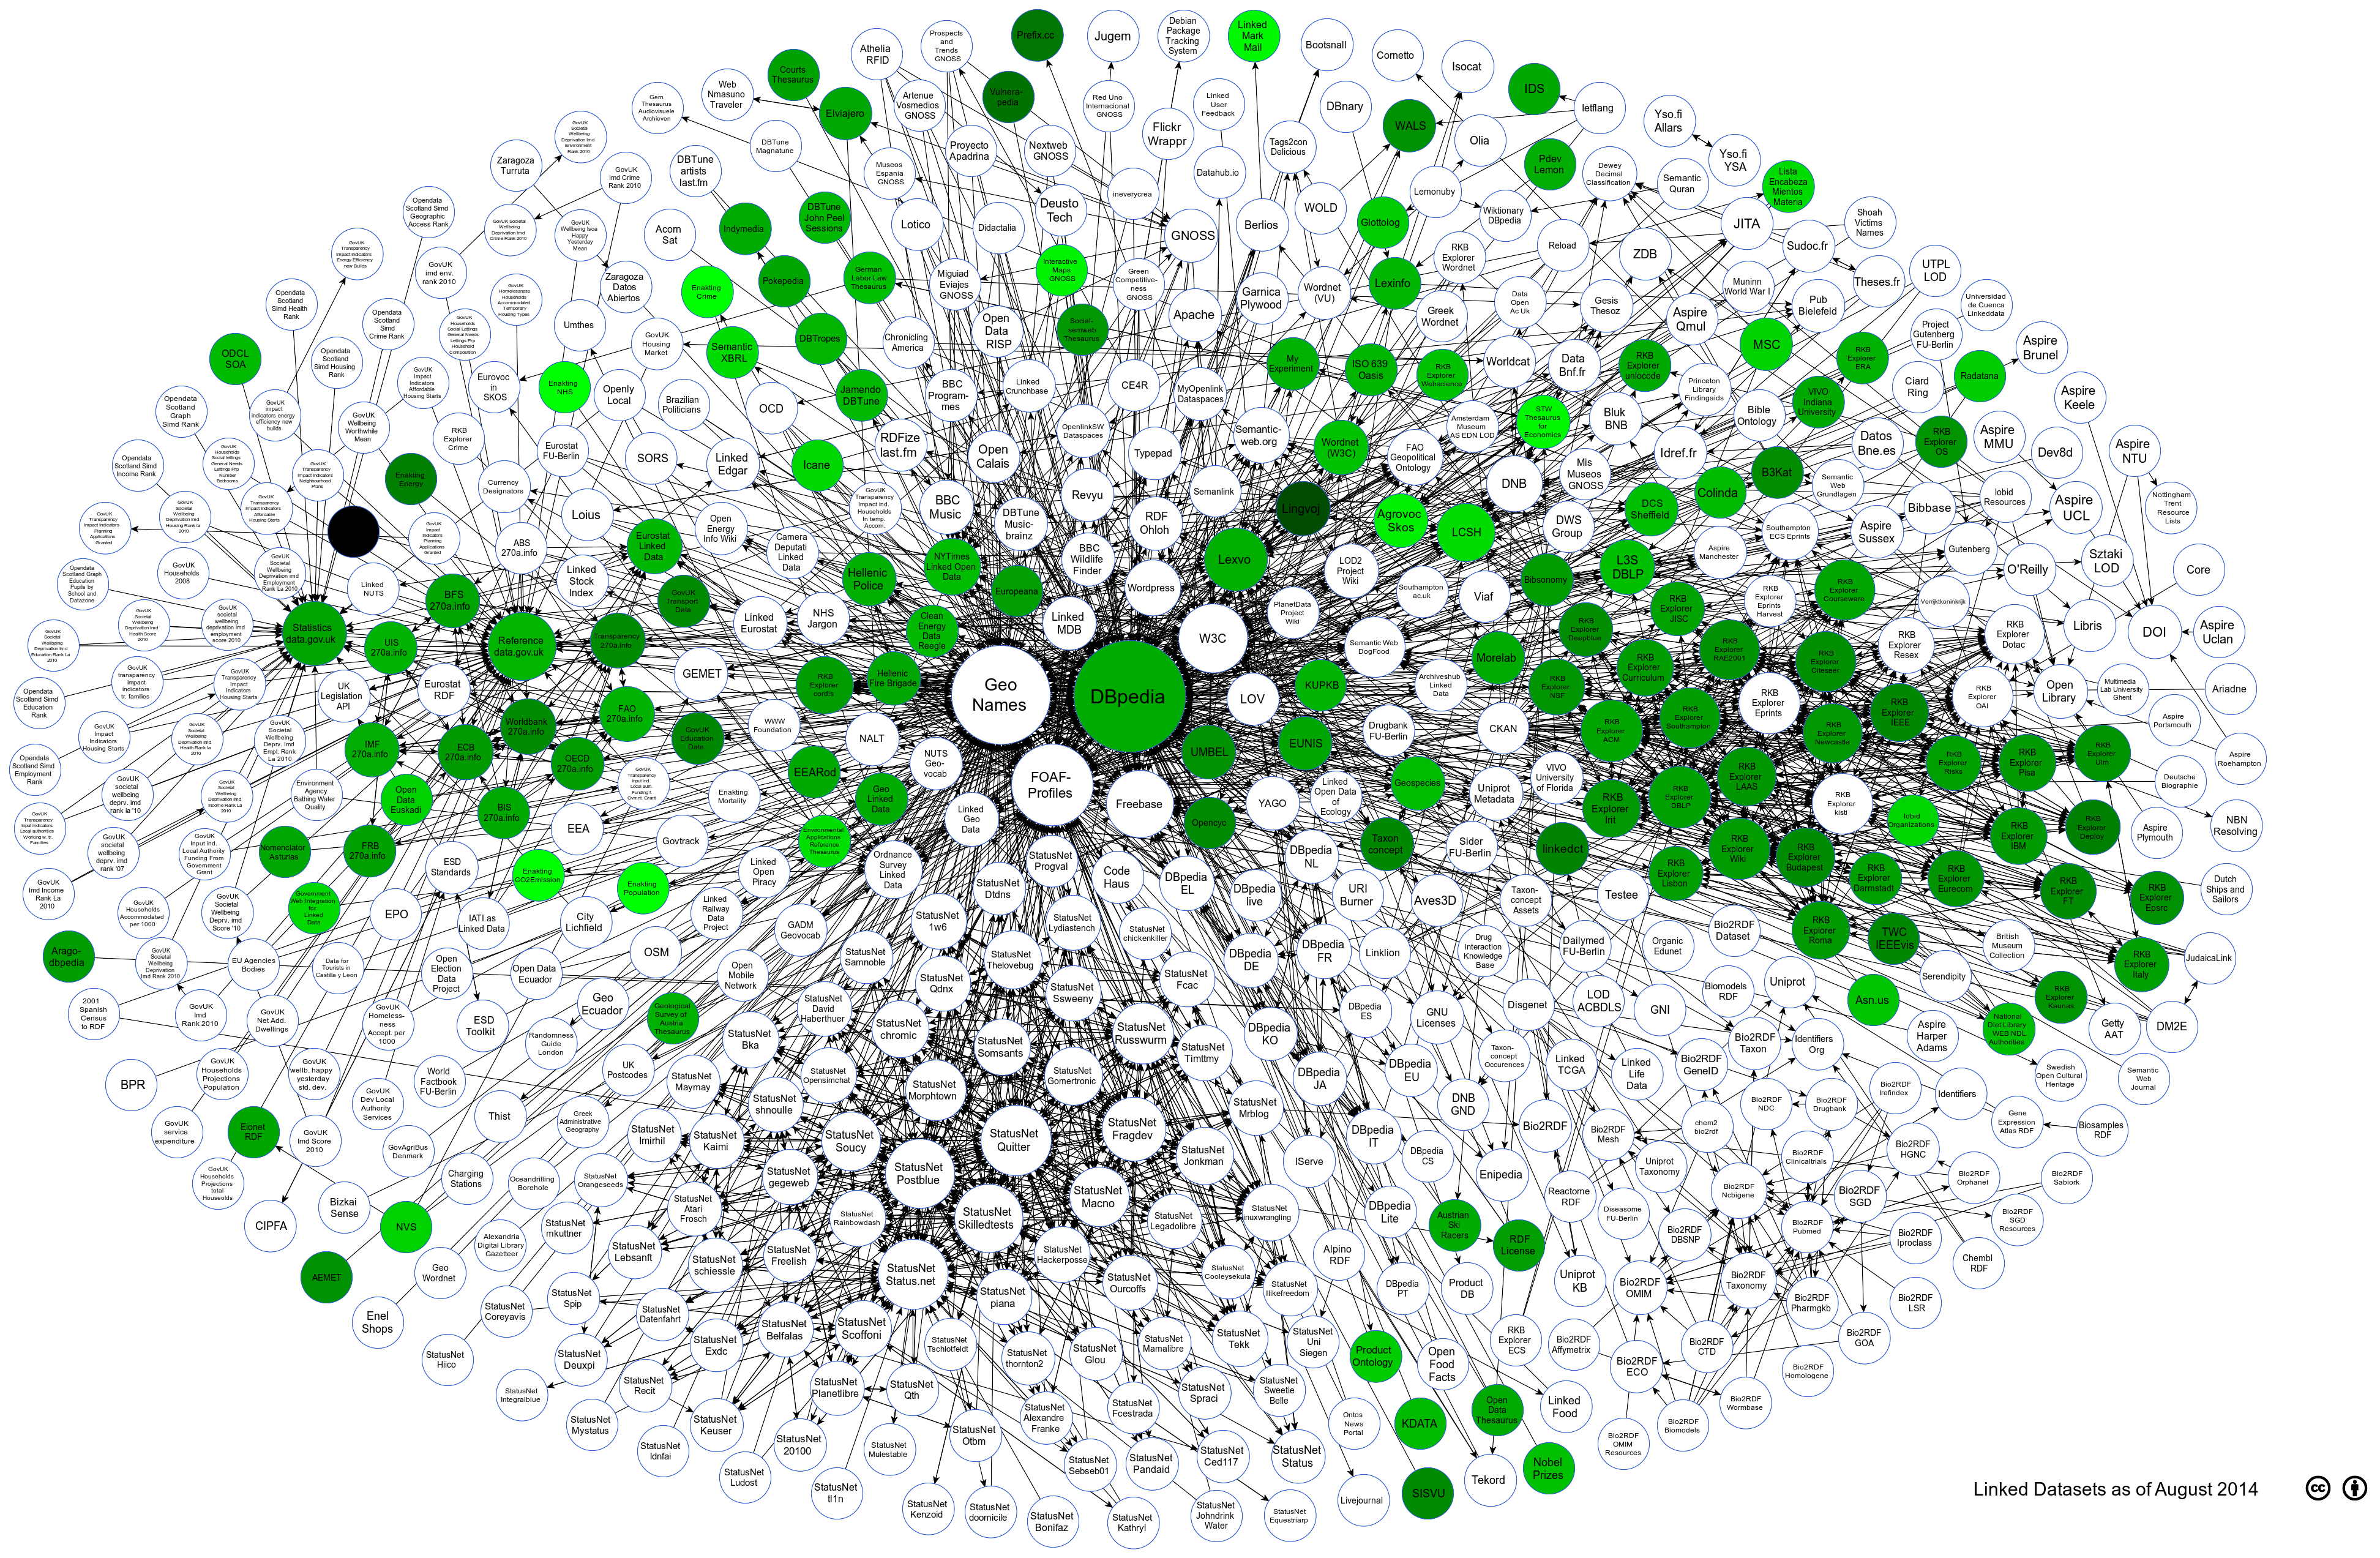
Visualising the Assessed LOD Cloud Datasets against the Representational Category
The visualisation below shows how different datasets fare against each other against the Intrinsic Category metrics. The darker the color of the circle means that it has lower conformance score. Results show sufficient good quality and a moderate distribution. However, in this case, data publishers should make sure to follow LD principles and were possible re-use existing terms by looking for schemas and ontologies in services such as linked open vocabularies or swoogle
Summary Statistics
- Average Conformance: 63%
- Standard Deviation: 14%
- Data publishers should re-use more existing terms (average conformance ≈ 34%)
Attribution
Linking Open Data cloud diagram 2014, by Max Schmachtenberg, Christian Bizer, Anja Jentzsch and Richard Cyganiak. http://lod-cloud.net/"
